


In just 2 minutes and 5 clicks, you can answer the question your CEO has been asking all year but you never had time to tackle.
Are we getting users from ChatGPT?
I’ve created this quick guide for busy founders and marketers. It’s a simple, no-fluff, no-bullsh*t playbook for understanding how much traffic ChatGPT, Perplexity, Gemini, and others are sending to your site.
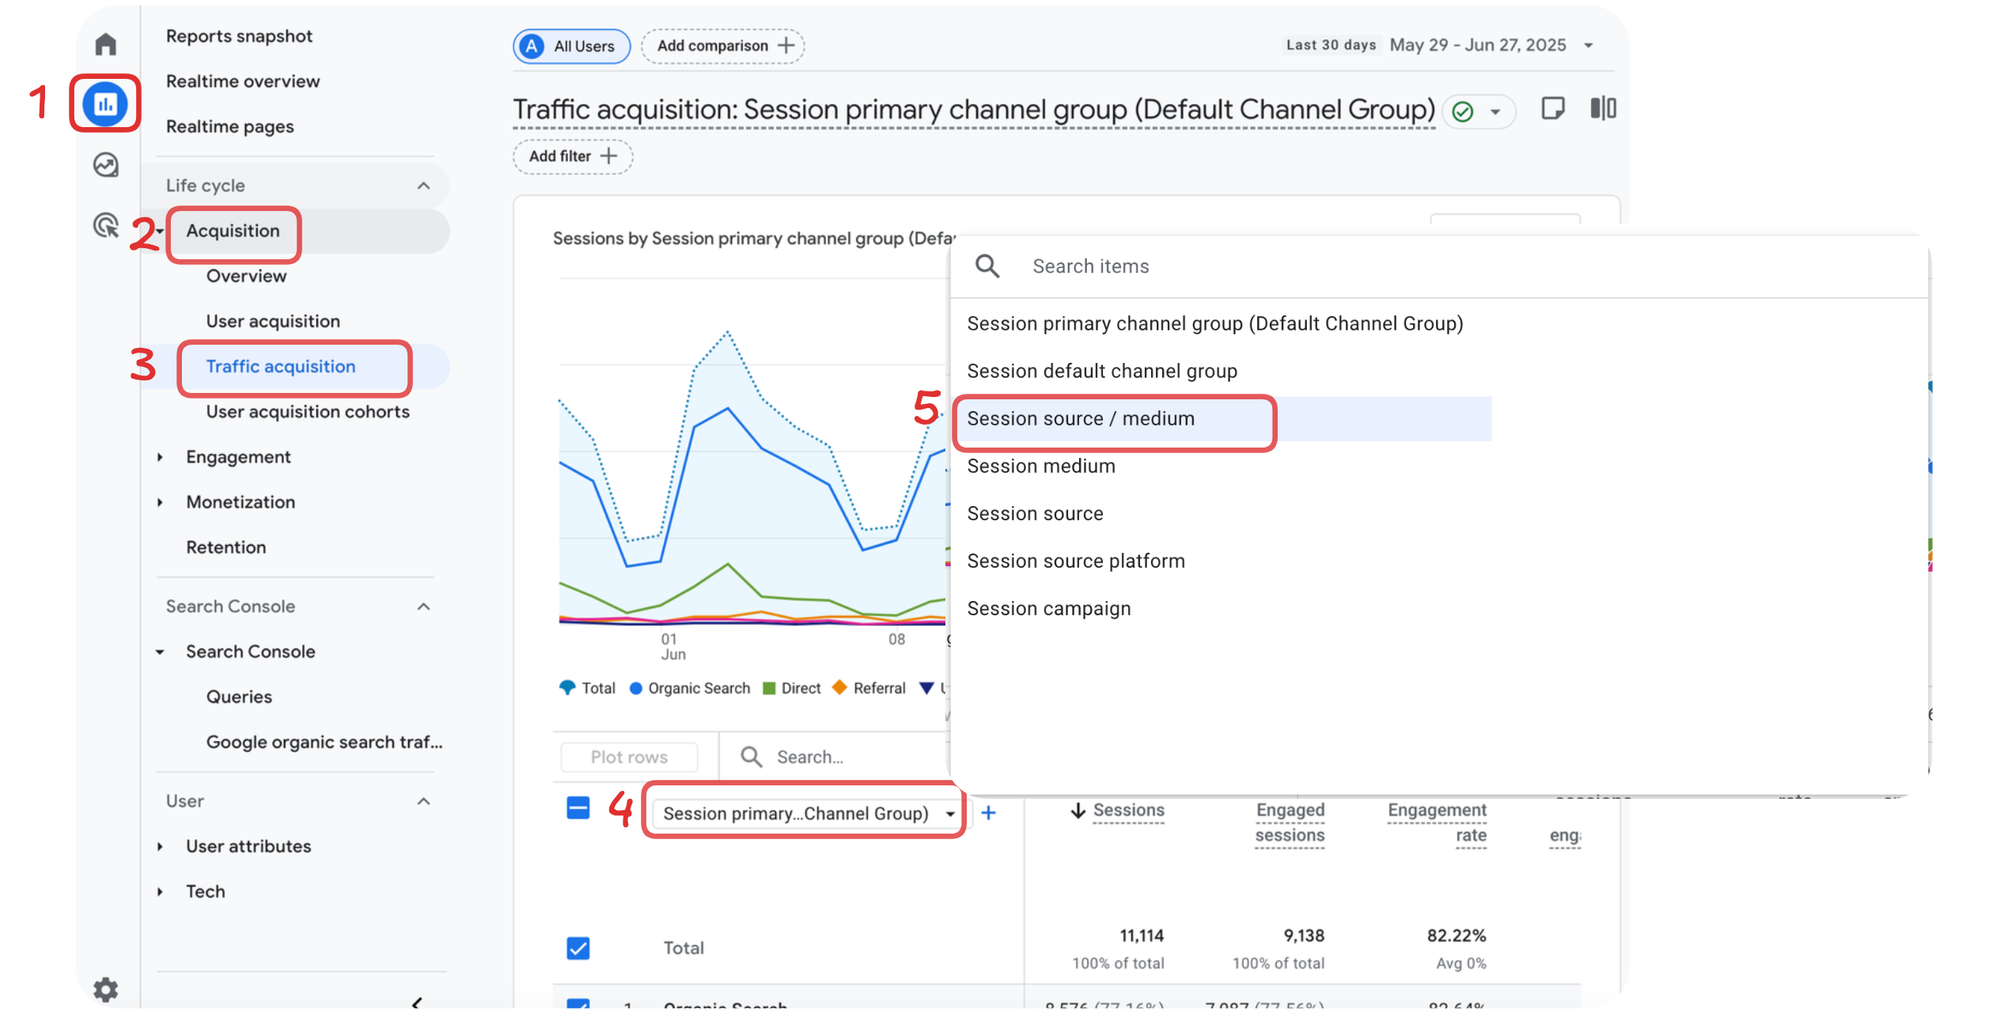
Start by opening your Google Analytics.
- Click the Reports icon in the left menu.
- In Life cycle, open Acquisition.
- Select Traffic acquisition.
- Above the table, open the picker Session primary channel group.
- Choose Session source / medium.
Now, you have the structure of your traffic by channel.
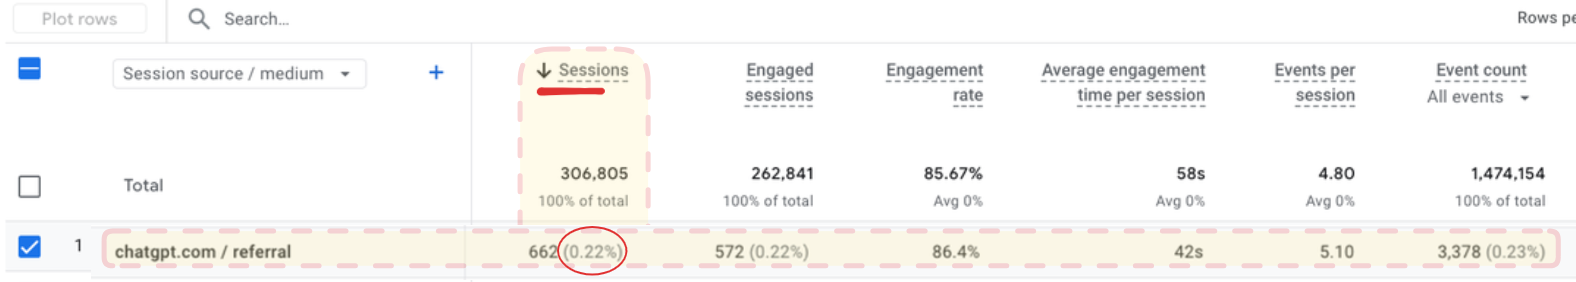
AI Search traffic is often below the default top-10 list. Set Rows per page to 100, use the search box and type “chatgpt” to surface it quickly.
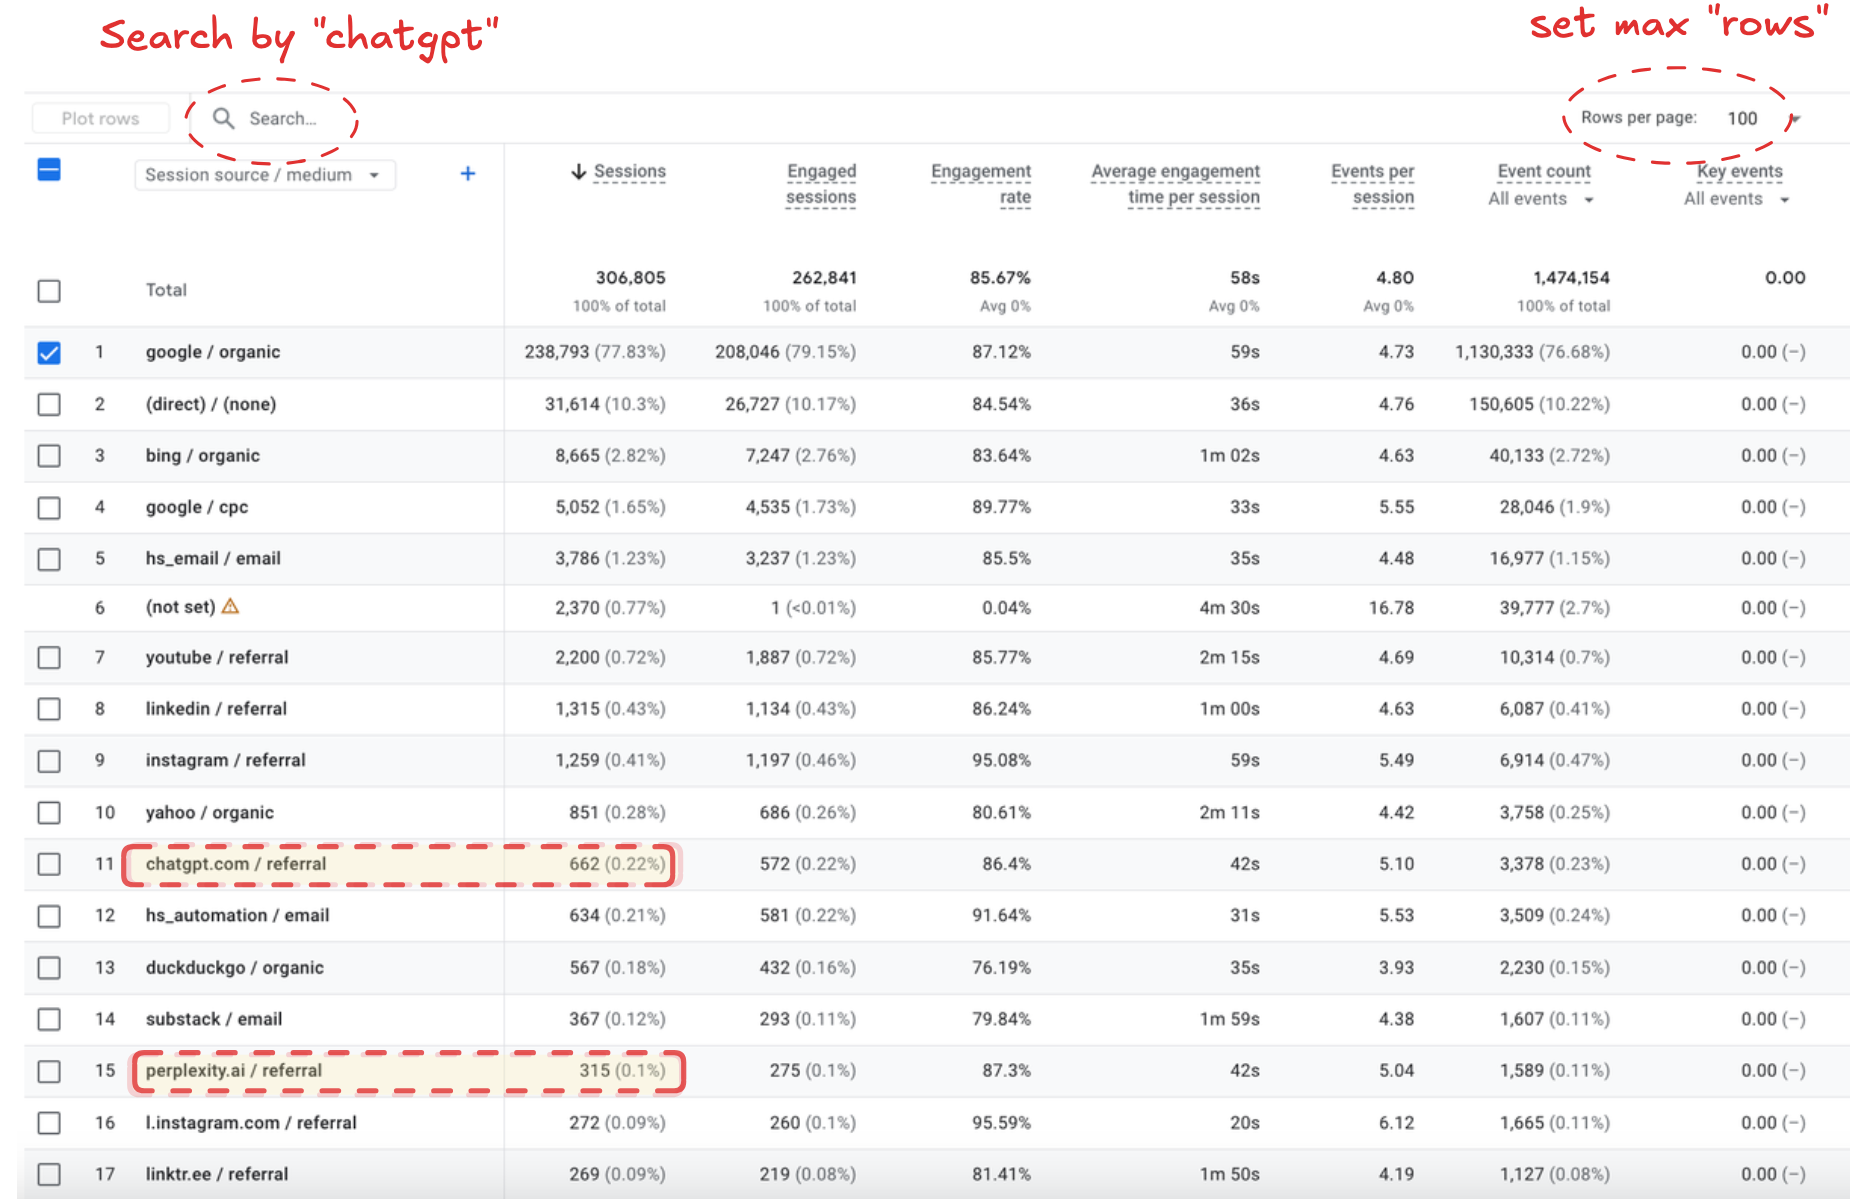
chatgpt.com / referral, and also as chatgpt.com / (not set). Add the two together for the full count.Comparing ChatGPT, Gemini, and Perplexity traffic over time
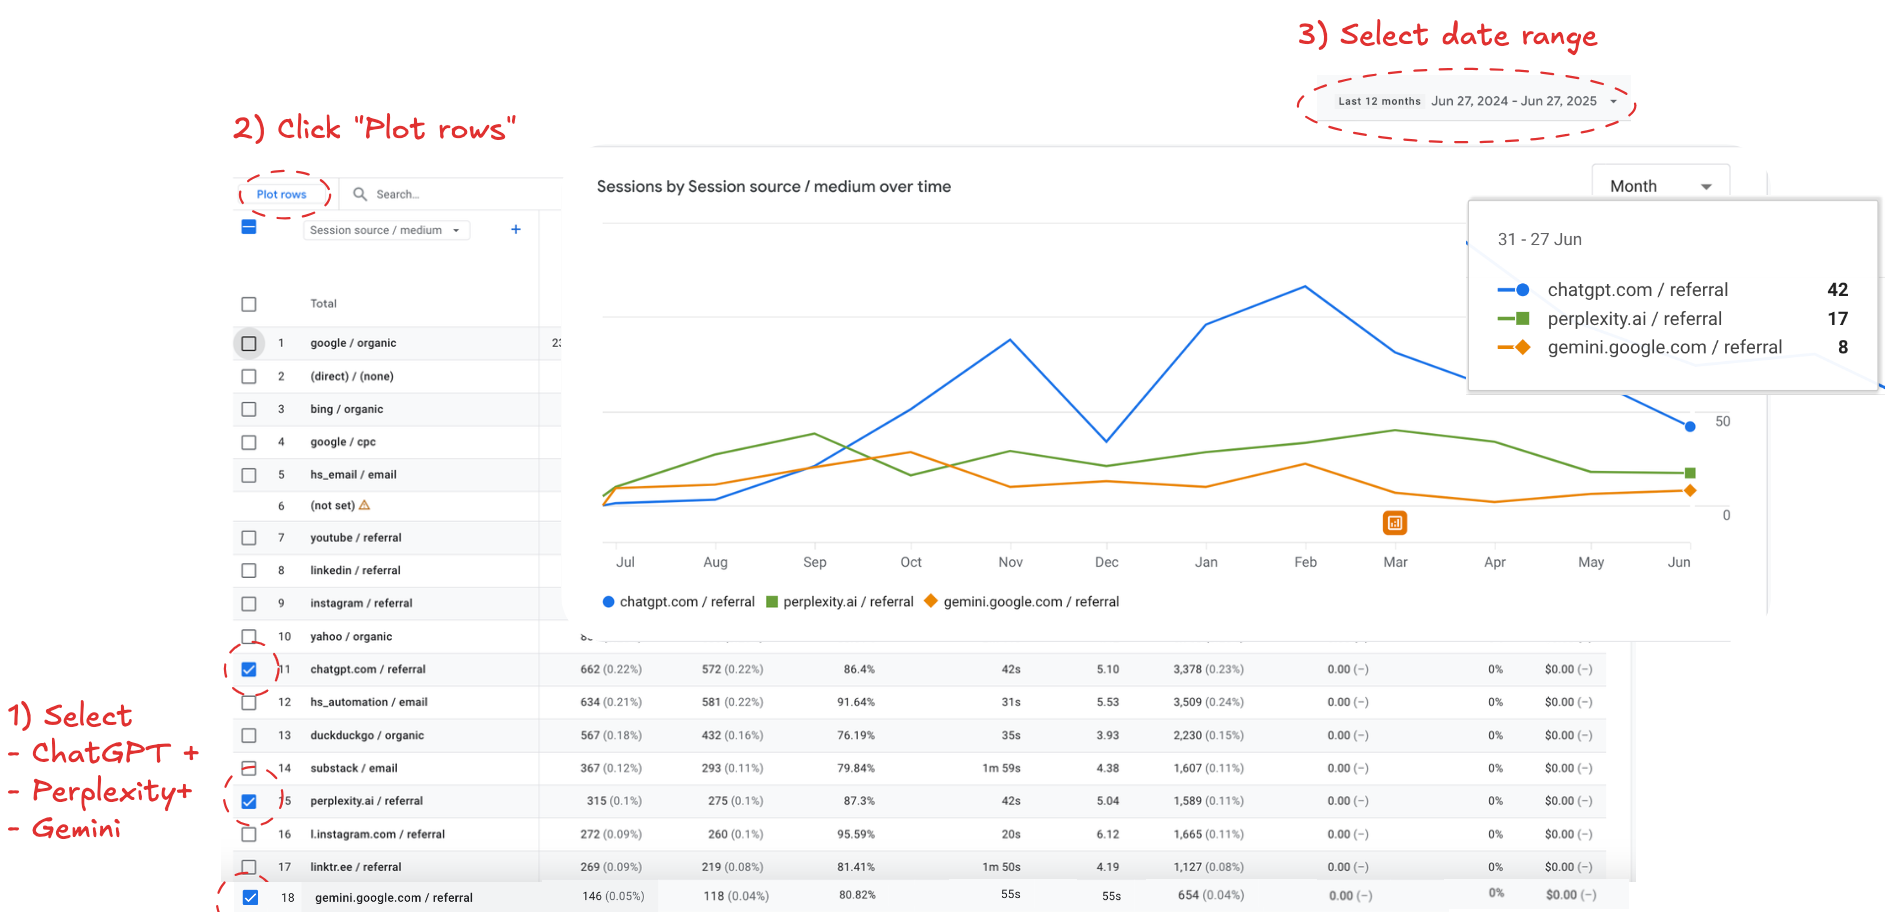
Say you want to dig deeper and understand how traffic is growing over time and the breakdown of AI Search traffic by provider (ChatGPT, Gemini, Perplexity, etc). Follow the steps:
- Tick the check-boxes for the AI sources you care about
- Click "Plot rows"
- Select "date range"
Making sense of AI traffic data
Add a layer of analysis once you’ve pulled the report. Here are some relevant questions you can use to extract high-value insights.
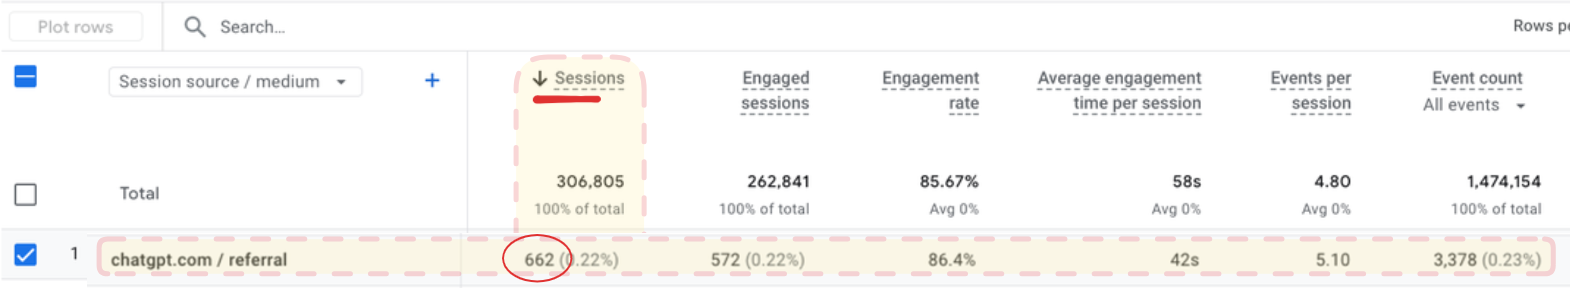
How many visits am I getting out of AI Search so far?
Start with raw volume: filter by the “AI Search” source group (ChatGPT, Perplexity, Gemini, etc.) and jot down the total sessions for your chosen date range.
What percentage of my overall traffic does it represent ?
This tells you how relevant AI Search is becoming to the business. For most sites, the combined share from ChatGPT + Perplexity + Gemini is still under 3% as of June 2025, so it rarely justifies a standalone growth strategy—yet.
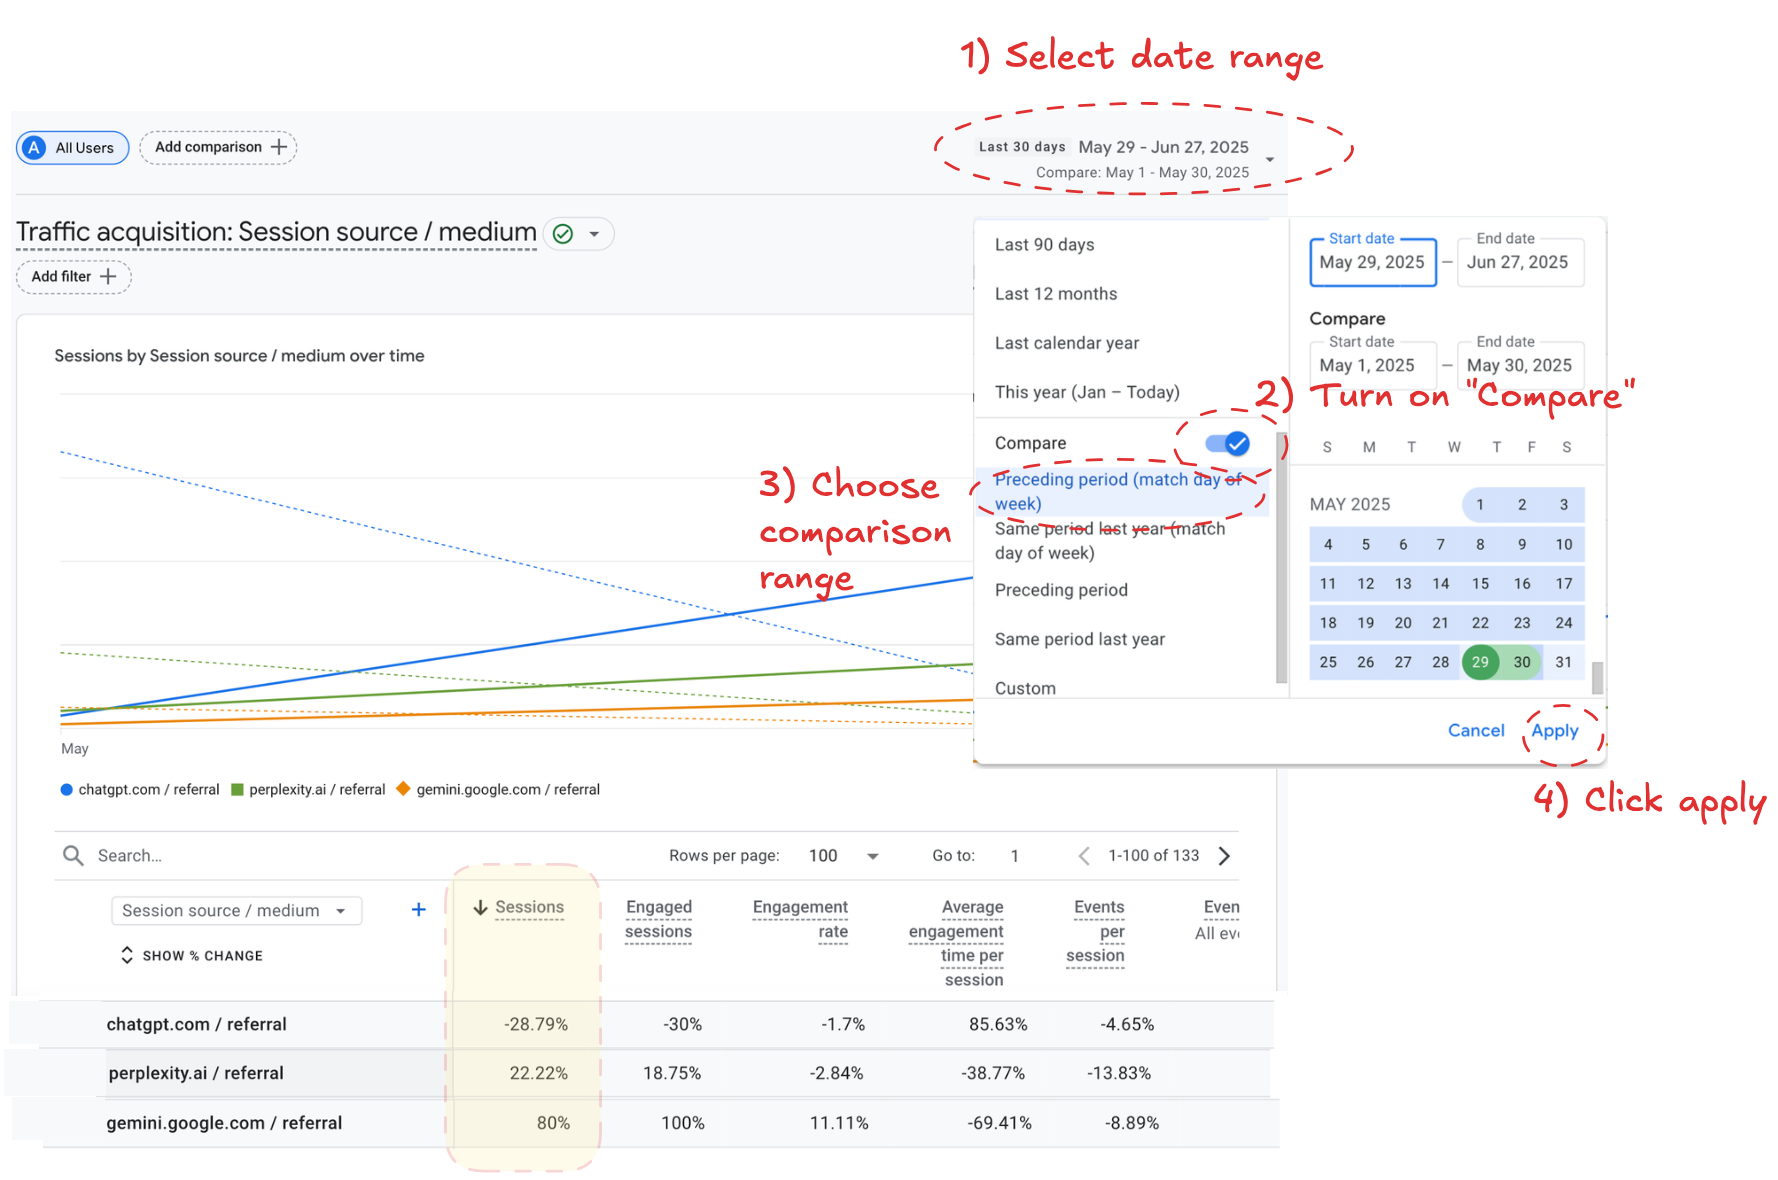
How fast is your AI traffic growing?
Set the date picker to the current month, toggle “Compare” → “Previous period,” and scan the delta column in the table below. A steady double-digit month-over-month lift is the early warning that AI Search deserves more focus soon.
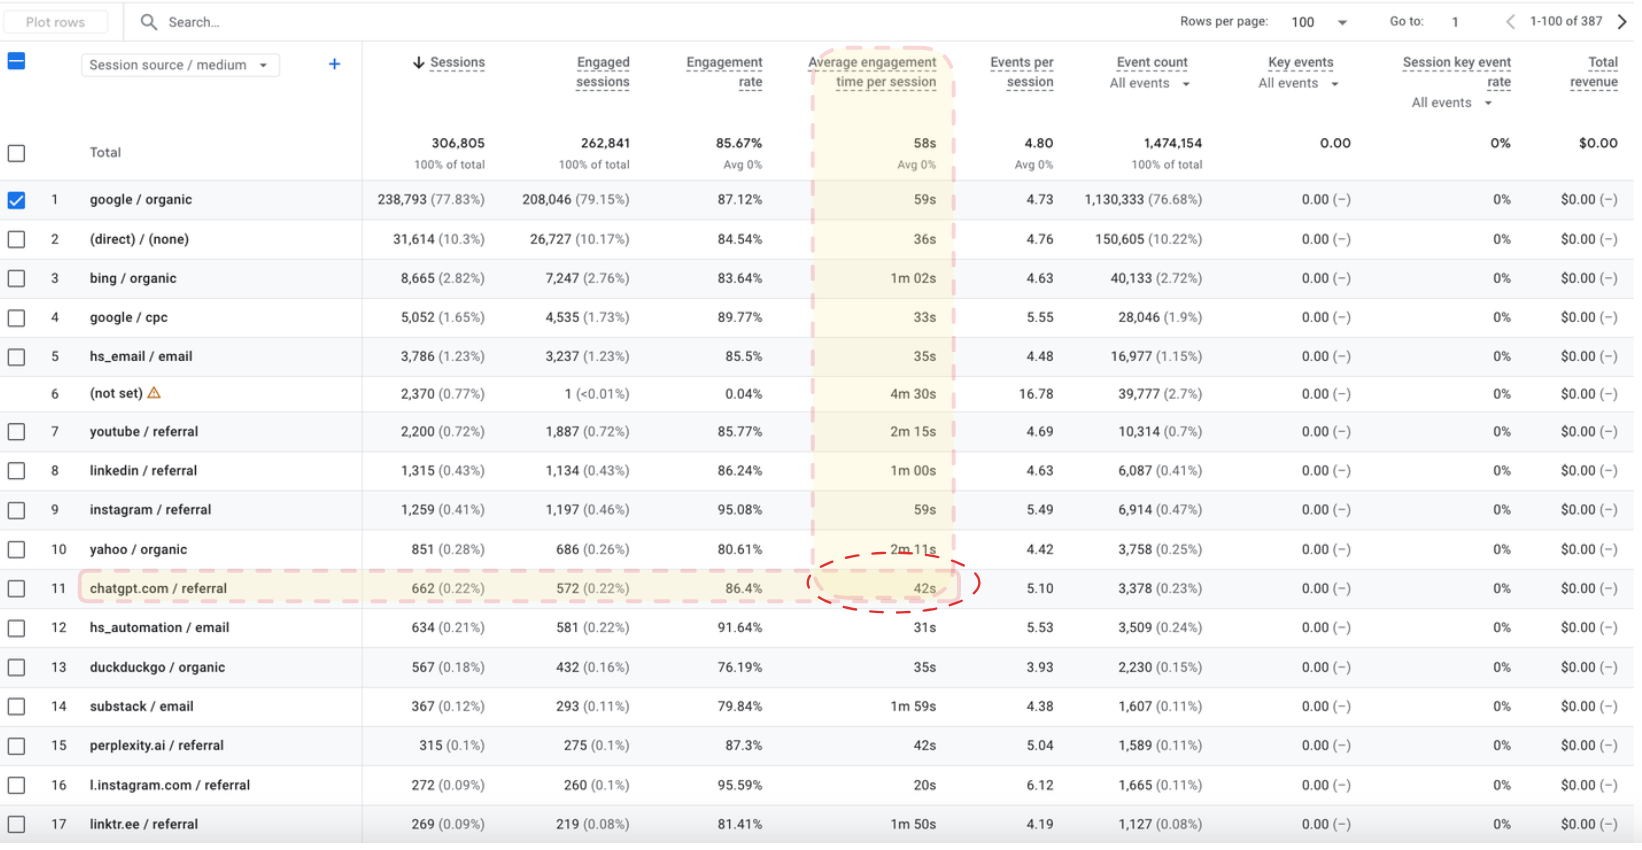
What does engagement for AI Search traffic looks like?
Check “Average engagement time per session”. Higher numbers signal deeper engagement, but expect AI Search traffic to run shorter than direct, email, or organic search. The more the average engagement time per session starts to approach that of these traditional channels, the more qualified is your AI traffic and the more opportunity there is in AI Search for your business.
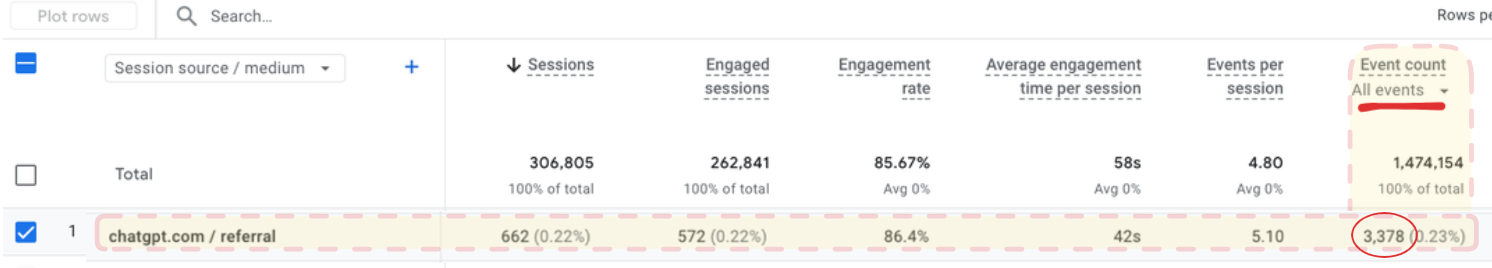
Are these visitors converting?
If the AI traffic is converting, it means it is highly qualified and worth more focused experiments, even if the overall volume is still small. Check this by going "Event count". (I'm presuming your event setup is right).
Communicating your findings to the team
If you followed the steps above, you are in a position to inform your CEO and team on something they are likely asking. Put it all together in a short informative message.
Template for a Slack message
Here is the template, feel free to copy and paste and add relevant data:
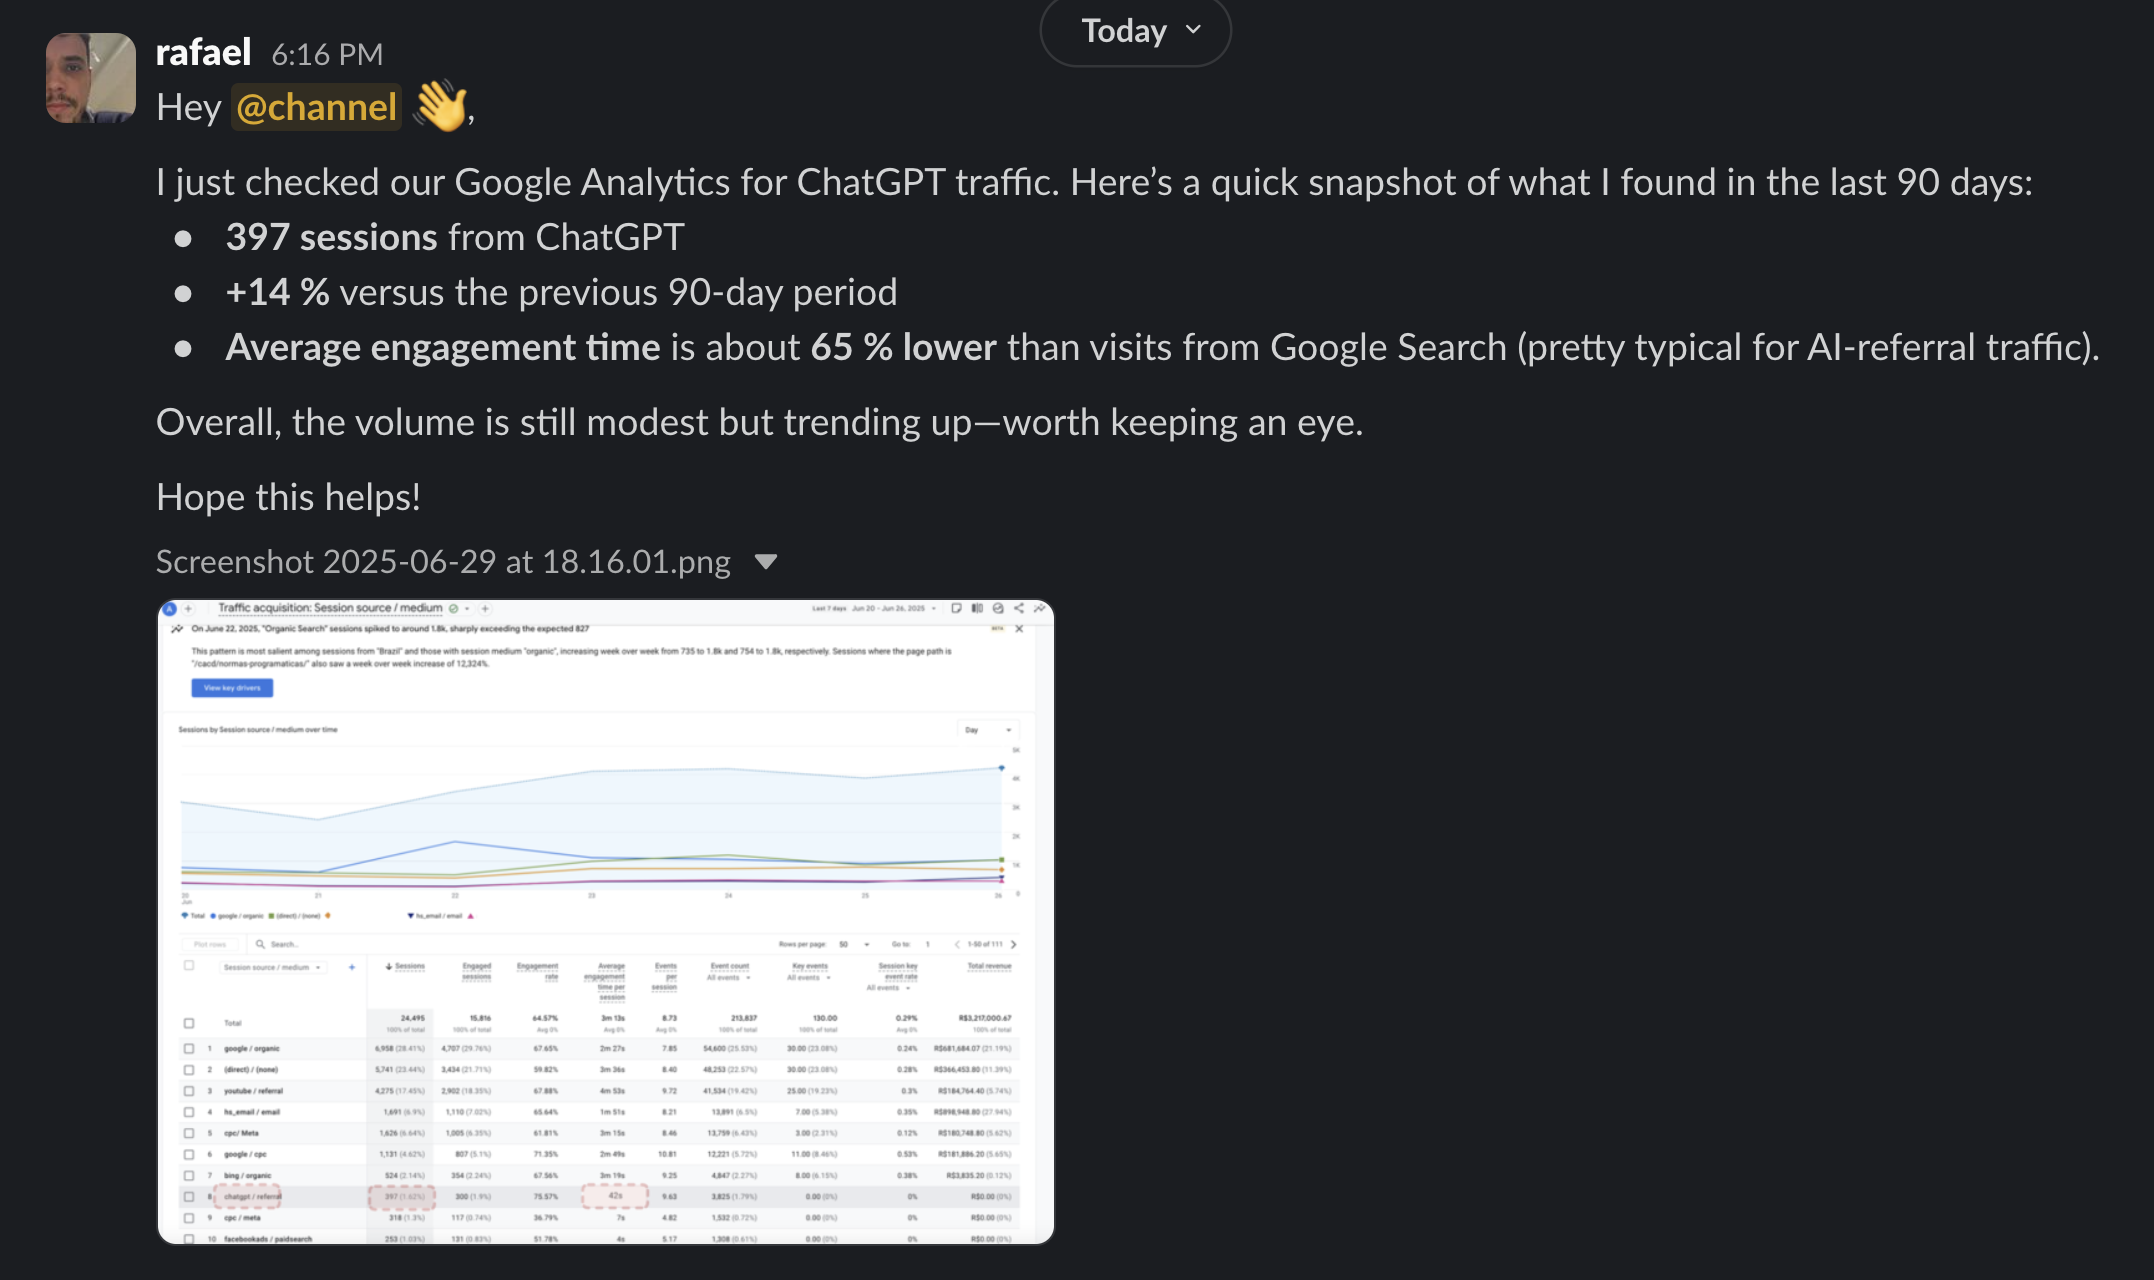
Hey @channel,
I just checked our Google Analytics for ChatGPT traffic. Here’s a quick snapshot of what I found in the last 90 days:
-____ sessions from ChatGPT
- ____ % growth (versus the previous 90-day period)
- Average engagement time is about ____% lower than visits from Google Search (looks typical for AI traffic).
Overall, the volume is still modest but trending up. Worth keeping an eye.
Hope this helps!
[[Google Analytics screenshot]]
Closing thoughts
For most companies, AI-search traffic is still too small to justify a dedicated AI Search strategy for now. But people will soon ask you about this. Proactively checking how much you’re getting and how those visitors behave answers those questions, frees up mental bandwidth for busy founders and marketers, and shows when (or if) a separate AI-traffic plan will be worth the effort.
Get notified when I make more of these 👇